ByteHouse: Designing a Cloud Data Warehouse from 0 to 1
Role: Lead Product Designer
Company: ByteDance
Project Type: Product Design · User Research · System Design
Background Overview
ByteHouse was born from ByteDance's growing demand for advanced data processing and analytical capabilities, as the company scaled rapidly across multiple business lines. Initially, ByteDance engineers began by heavily customizing the open-source database engine ClickHouse, addressing key challenges such as high query latency, the complexity of massive data operations, and the rising costs of storage and computation.
Through years of technical refinement, the engineering team optimized query algorithms, enhanced storage architecture, and significantly improved system responsiveness. These efforts laid the foundation for ByteHouse, a modern, high-performance, cloud-native data warehouse that retained and improved upon ClickHouse’s strengths in columnar storage and vectorized query execution—now capable of millisecond-level query latency at scale.
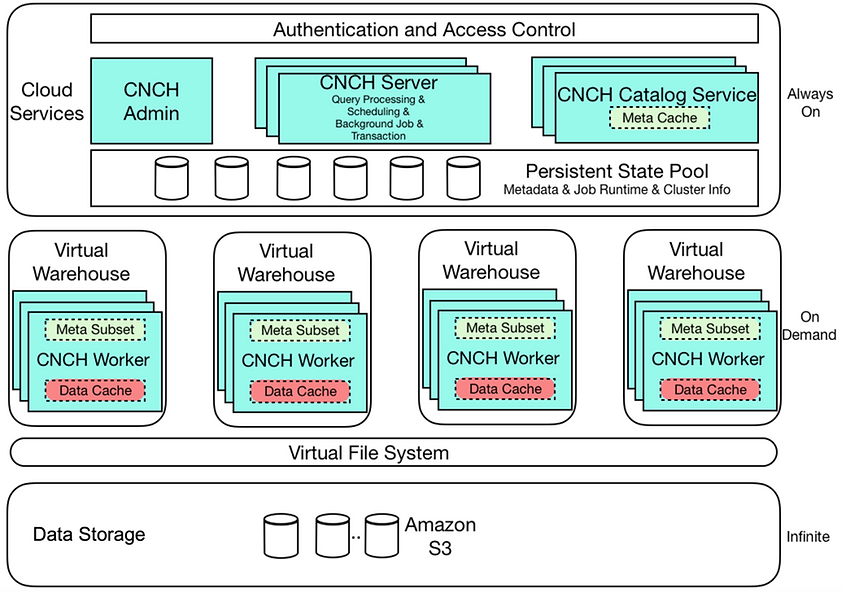
A pivotal moment in the evolution of ByteHouse came when the team drew inspiration from Snowflake’s compute-storage separation model. This led to the development of a cloud-native architecture based on containerized compute clusters. By separating compute and storage layers and orchestrating workloads through Virtual Warehouses (VWs), ByteHouse enabled highly efficient resource utilization and significantly reduced infrastructure costs. The platform leveraged Kubernetes for managing elastic, containerized clusters, allowing the system to auto-allocate compute based on workload type and scale.
As a result, ByteHouse became a fully managed Database-as-a-Service (DBaaS) designed for analytical workloads in the cloud. Its value proposition includes:
-
No infrastructure management — fully abstracted hardware/software setup
-
Serverless scalability — on-demand compute scaling via Virtual Warehouses
-
Built-in analytics stack — SQL IDE, data ingestion, access control, monitoring
-
Business-oriented performance — support for advanced analytical SQL functions tailored for real-world use cases
As the Lead Designer for ByteHouse, I was responsible for defining and executing the end-to-end user experience for the platform’s 1.0 release. This included early-stage user research, interaction and interface design, usability testing, and post-launch iteration. The following walkthrough outlines how we translated complex data infrastructure into an intuitive, user-friendly product for data engineers, analysts, and admins.
Understanding the technologies
Key Concepts
-
Virtual Warehouse (VW): A cluster of compute resources, is short as VW.
-
Why do we need VW? Because VW aims to simplify the way users handle resource and show cloud scalability intuitively. VW is primarily used for running queries, but it's also used for other operations such as data loading.
-
-
Databases: A web interface to show at conceptual level, how all of the data tables/views are organized, and how the users in the org use those data objects.
-
Data Import: A web UI based data ingestion functionality. Users use it to build connections to different type of data sources and load data into ByteHouse databases for analytics purposes.
-
Query & Worksheet: An IDE environment with user friendly UI designed specifically for analyst users.
-
For analyst users, they can edit and run SQL statement in the web UI, quickly get query results.
-
Users use it to explore data and do analysis in a topic and save it for future use/share.
-
For the administration roles, they can check on query execution history and find out which part of queries executed slowly; and diagnose based on query profile and give advise to optimize the performance.
-
-
Execution History & Profiling: Analyze performance bottlenecks via query DAGs.
Define User Persona & Information Architecture
Before diving into high-fidelity design, I started by mapping out the end-to-end user flow across key personas — data analysts, data engineers, and administrators. ByteHouse is a technically powerful platform, but one of our primary design goals was to simplify complexity and make high-performance data tooling approachable, even for less technical users.
Key Design Challenges:
-
Aligning product architecture with mental models of different user types
-
Supporting power users without overwhelming first-time users
-
Creating smooth navigation between interconnected modules (e.g., SQL → Tables → Permissions)
-
Ensuring scalability of the UI for growing product scope
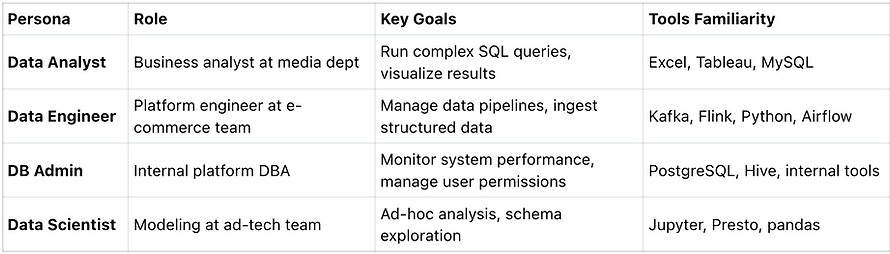
User Personas
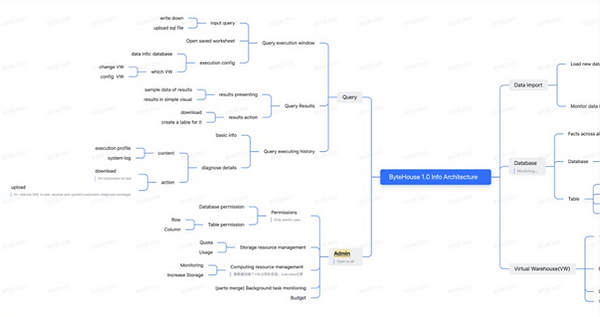
Information Architecture
We structured the platform into 5 main product pillars: Query, Admin, Data Import, Database, and Virtual Warehouse.
Design Prototypes and Validate
After establishing the product vision and core workflows, I created a series of high-fidelity prototypes using Figma to simulate real product interactions across the following core modules:
-
Database Management
-
Data Import Pipelines
-
Virtual Warehouse Configuration
-
SQL Worksheet and Query Profiling
Each module was designed with modular UX patterns that could scale across different user roles—analysts, data engineers, and administrators. I worked closely with PMs to define feature scope and edge cases, and collaborated with engineers to ensure feasibility of interaction logic and system behavior.
Design & Research Objectives
Before launching ByteHouse 1.0, our goal was to validate:
-
Is the product useful? Does it meet user goals across personas?
-
Is the product usable? Can users accomplish key workflows intuitively?
Our goal was to identify UX or workflow-level issues that could be fixed prior to release, and gather longer-term feedback for future iterations (1.5+).
Research Methods
We applied a mixed-method approach, combining exploratory and validative techniques:
-
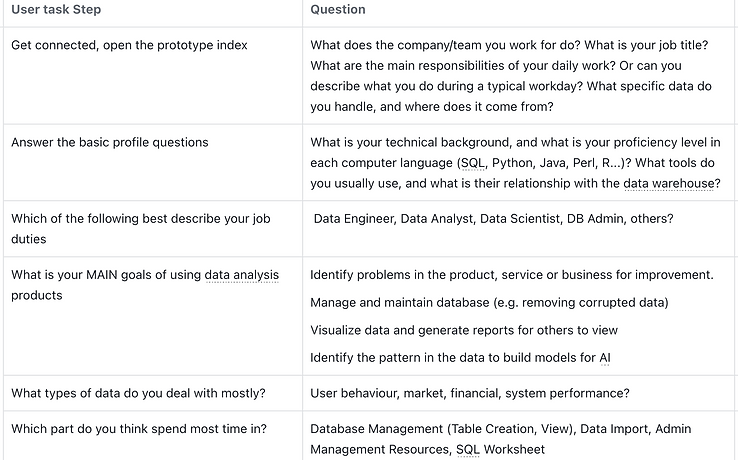
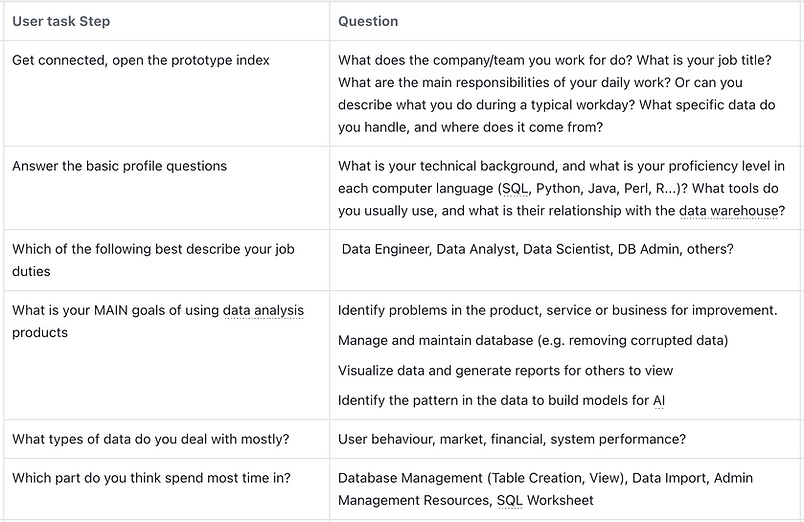
Exploratory Interviews: We asked participants about their daily workflows, tools, data management habits, pain points, and goals.
-
Prototype-Based Validation: We built a clickable prototype (static mockups in sequence) and asked participants to perform realistic tasks while thinking aloud. Observers noted behavioral cues and friction points.
User Research Process
-
The testing was conducted using a mockup prototype composed of a series of static screenshots. The prototype aimed to simulate the look and feel of the actual product user flow. Participants were instructed to interact with the prototype as if it were the real product, although only predefined functions were interactive, and certain UI behaviors did not fully reflect the final product experience.
-
The testing covered several core product components. For each component, 8 participants were given specific tasks to perform. There were no right or wrong answers—what mattered most was observing how users naturally reacted to the design. Participants were encouraged to think aloud during the sessions, sharing their thoughts, expectations, and interpretations as they navigated the interface.
-
Feedback regarding any confusion, usability issues, or ideas for improvement was highly encouraged. Observers welcomed all opinions on design logic and potential alternatives.
Test User Personas
To ensure ByteHouse met the needs of real-world users, we recruited 8 participants(2 Data Analysts, 2 Data Engineers, 2 DB Admins, 2 Data Scientists) from both internal ByteDance teams and external enterprise users. These participants represented the full spectrum of expected users of ByteHouse:
User Tasks (testing scenarios)
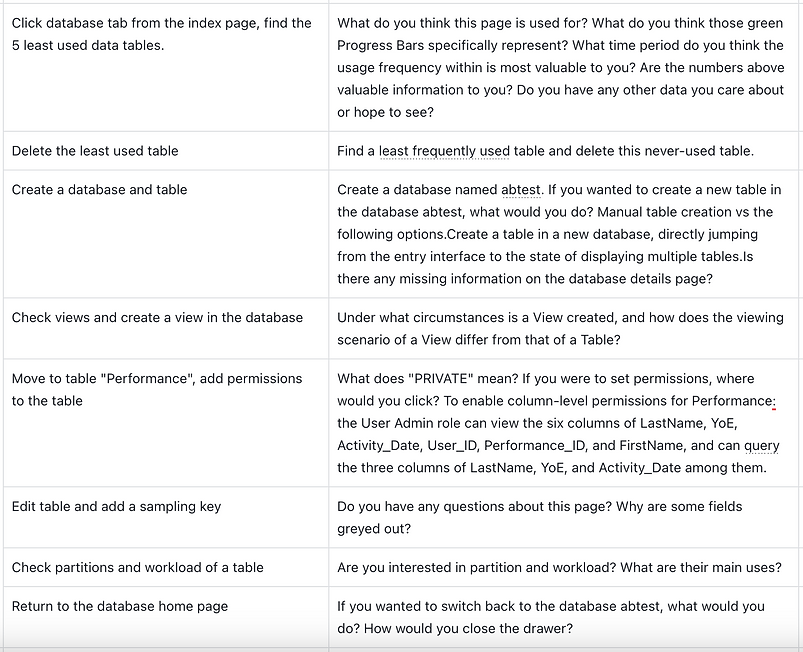
A. Database
1. Find the least used tables in the database homepage. - [Explorative] Are those data points on the home screen valuable for users? - Find the least frequently queried tables across all databases. - delete one of them from the respective database.
2. Create a table in a database. - User add more than 3 columns. - Choose keys from the columns.
3. Add permissions to the table. - Add query permission for public role, - Add edit permission for system admin, - Add column level permission, - [Explorative] Ask about the "Set to open" option
4. Views
5. Partition
6. Workload
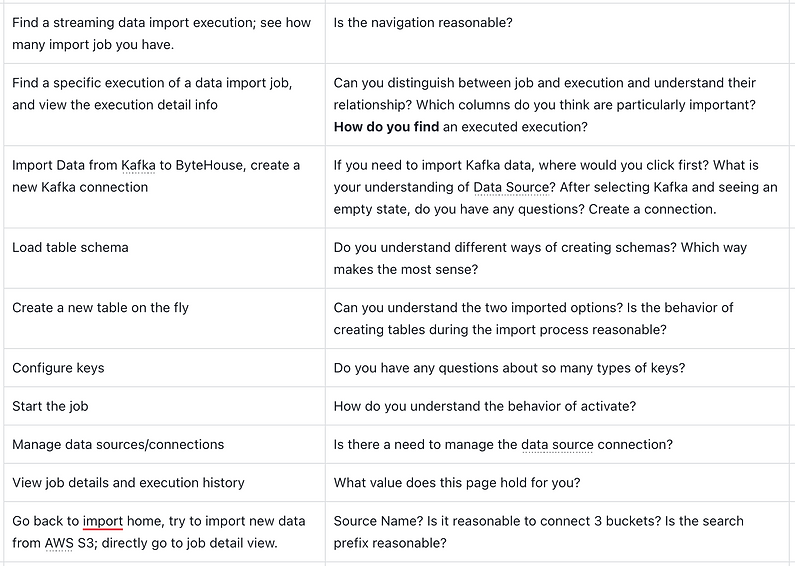
B. Data Import
-
Import Data from Kafka to ByteHouse, create a new table on the fly:
-
Create a new Kafka connection
-
Load table schema
-
Review the mapping to the existing table UI
-
Import the data as a new table (under an existing DB)
-
Configure the keys
-
Start the job
-
-
Manage data source, remove an existing connection:
-
Open the data source management page.
-
Add a new connection type.
-
Remove an item from the existing connection type.
-
-
Review execution history
-
[Explorative] What are the primary use cases for view the execution history?
-
Find the import job, and view the job details, and check the data loading volume trend in the last 14 days.
-
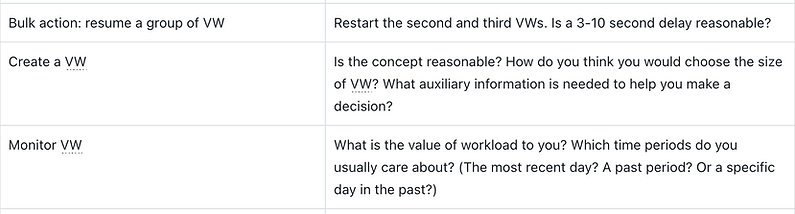
C. Virtual Warehouse
-
Import Data from Kafka to ByteHouse, create a new table on the fly:
-
Create a new Kafka connection
-
Load table schema
-
Review the mapping to the existing table UI
-
Import the data as a new table (under an existing DB)
-
Configure the keys
-
Start the job
-
-
Manage data source, remove an existing connection:
-
Open the data source management page.
-
Add a new connection type.
-
Remove an item from the existing connection type.
-
-
Review execution history
-
[Explorative] What are the primary use cases for view the execution history?
-
Find the import job, and view the job details, and check the data loading volume trend in the last 14 days.
-
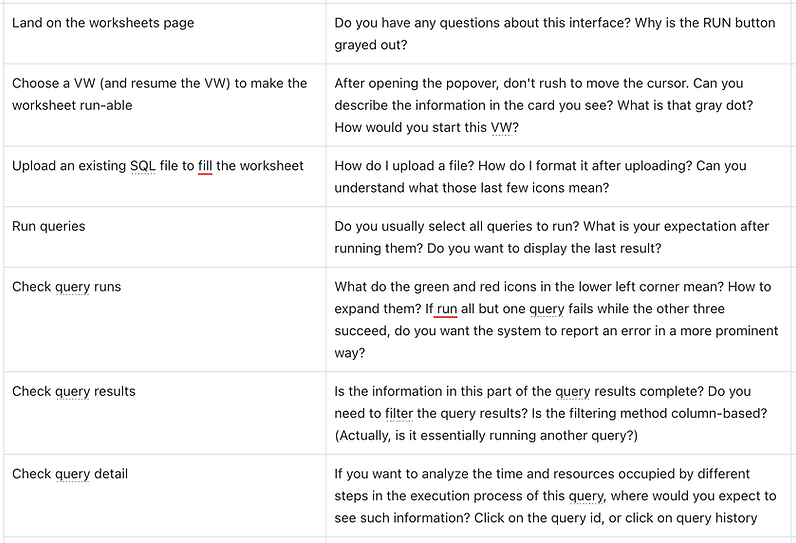
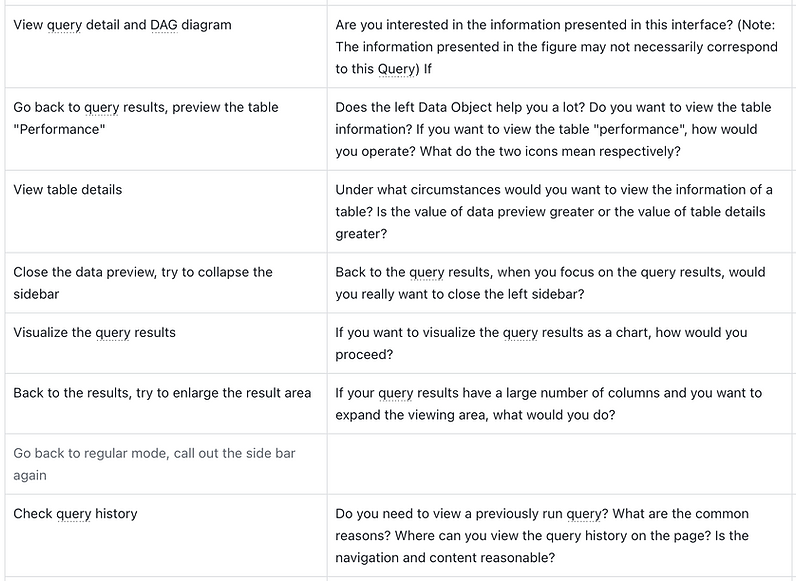
D. Queries & worksheets
-
[Navigation] left nav reaction
-
Switch tab to function and saved worksheets
-
Check query history
-
-
Edit queries
-
Upload a file to fill out the queries statements in the editor.
-
Format the queries and check the syntax.
-
-
Run queries
-
Choose a virtual warehouse.
-
Run all queries.
-
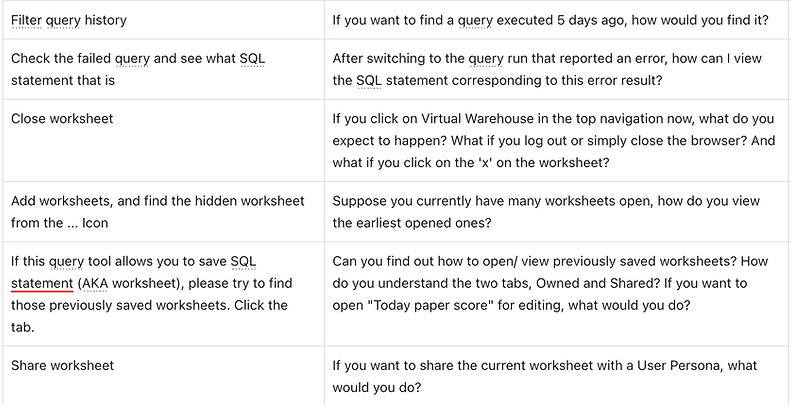
[Explorative] Ask about the "Query Runs", switch to the failed query.
-
Resize the "Query Runs" part.
-
View failure information and see the corresponding SQL text.
-
-
View query results
-
Ask what information is most important.
-
Filter by a column.
-
Make a visualization
-
Make the results displayed as full screen.
-
-
Add multiple worksheets
-
Click + to add multiple worksheets
-
[Explorative] Ask about working with many worksheets
-
Click the "..." to open the tab
-
-
Save & share worksheets
-
Click the save button to save the worksheet to the library
-
[Explorative] ask about the requirements for saving SQL text and describe the auto-save behavior; user can click on "x" to see a confirmation
-
Open a saved worksheet
-
Share a worksheet
-
-
Preview a data table
-
[Explorative] Is it more important to see the sample data or the table schema? Do you want to see multiple tables when you write up the query statement?
-
How can you open the details of a specific table?
-
-
Query history and profiling
-
If you want to see the execution details of a past ran query, where do you click?
-
How do you find a query run a while ago? (test the filter and search function)
-
How much value does the DAG diagram provide?
-
Scripts
Warm up
Database
Data import
Virtual Warehouse
Queries
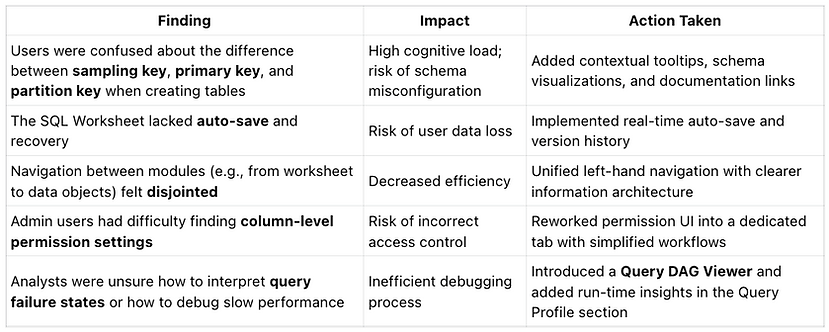
Usability Testing Results
Key Findings
Post-Testing Execution & Launch
As the Lead Designer, I worked closely with the Product Manager and Engineering Manager to:
-
Prioritize usability issues based on severity and development cost
-
Break down complex flows into smaller, iterative UI changes
-
Collaborate in agile sprints to implement fixes and test improvements
-
Document design decisions and communicate rationale to cross-functional stakeholders
Together, we shipped a production-ready ByteHouse v1.0, incorporating all critical usability improvements identified during testing. These improvements significantly enhanced the onboarding experience and core workflows across personas.
Customer Impact: First Deployment with Anker
Our first external customer deployment was with Anker, a global e-commerce brand. They adopted ByteHouse to power their data operations system, focusing on high-concurrency, complex SQL-based analysis.
Real-world Testing Conditions
To validate performance and usability post-launch, we conducted a production-level benchmark using Anker’s real SQL workload, rather than synthetic benchmarks like TPC-DS.
-
Query Set: 20 real-world SQL statements, covering ~80% of Anker’s data operation needs
-
Use Cases: Measuring user visits, clicks, product views, and conversion rates
-
Query Complexity: Included nested subqueries, multi-table JOINs, advanced filtering, and aggregation
-
Concurrency: 24 concurrent users, average results calculated over 12 runs
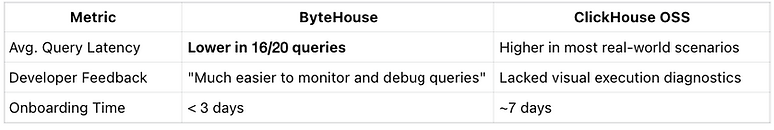
Quote from Anker Data Engineer:
"The SQL worksheet and query profiling tools helped us optimize performance without relying on backend engineers. The UX feels intuitive even under complex conditions."